Blue now has best-in-class limits
I compared every major process management platform's real record limits, found most cap out surprisingly low, and engineered Blue to beat all of them — at every tier.
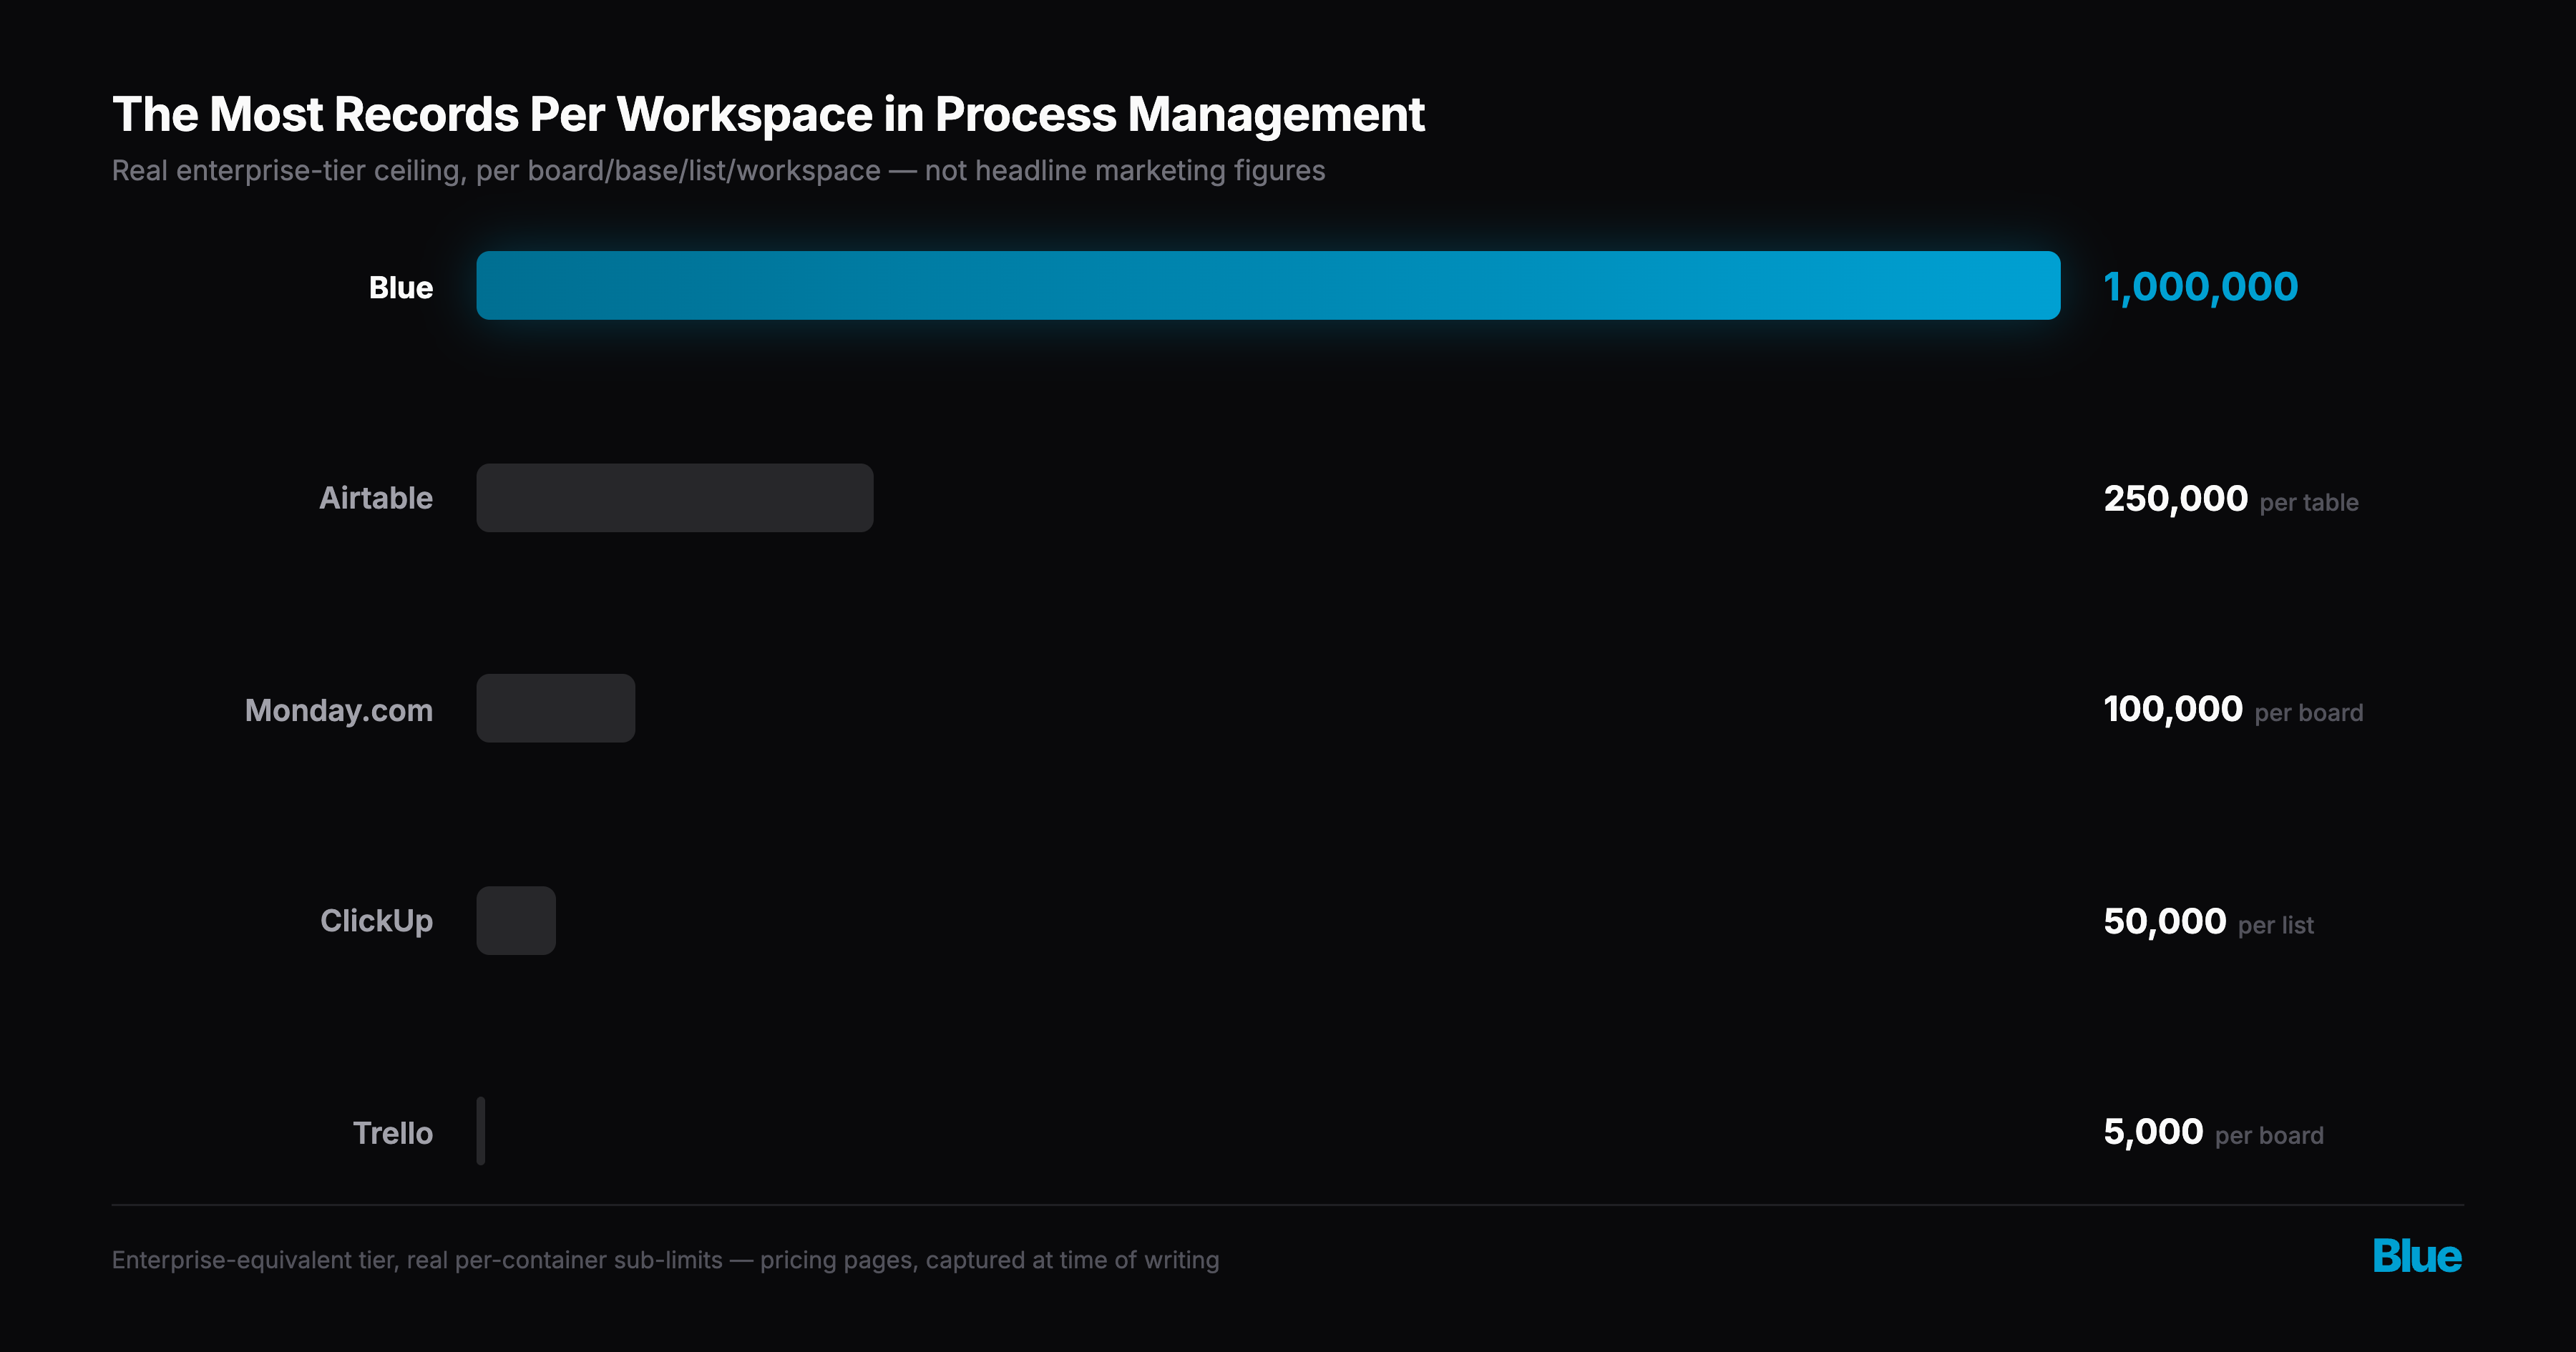
Blue now supports up to 1,000,000 records per workspace on Enterprise, 500,000 on Pro, and 50,000 on Starter — Blue’s entry-level paid plan already out-scales the paid plans of most of the tools I compete with.
Picking a bigger number for a pricing page is the easy part. Before I’d commit to these, I wanted two things to both be true: the numbers had to genuinely beat what’s actually available elsewhere, not just the headline marketing figure, and the product had to perform at that scale in practice, not just in theory. This post is about both — what I found when I looked closely at what competitors actually offer, and the engineering work behind making sure my own numbers hold up.
What everyone else actually allows
I went through the pricing pages and documentation of every major platform in this space, and the gap between the marketed number and the real one shows up almost everywhere you look.
Monday.com’s free tier caps out at 200 items total across your entire account — not per board, per account. That’s a very different number from the “10,000 items” figure that gets repeated around the web, which is actually the paid-plan number. Even on paid plans, 10,000 per board is the ceiling all the way up through their Standard and Pro tiers. Only Enterprise, on their newer “mondayDB” infrastructure, reaches 100,000 per board.
Airtable markets “500,000 records per base” on their top Enterprise Scale plan. A base can hold multiple tables, though, and the real, enforced sub-limit is 250,000 records per table — half the headline figure, and the number that actually matters if your data lives in one table the way most operational data does.
ClickUp holds steady at 50,000 items per list across every tier, free through Enterprise — the most consistent of the group, but also a ceiling that doesn’t move no matter how much you pay.
Trello caps every tier, including Enterprise, at 5,000 cards per board. Given how many teams still run lightweight processes in Trello, that’s a surprisingly low number to hit.
Asana doesn’t publish a hard item cap — their marketing says “unlimited” — but Enterprise workspaces are still capped at 150 custom fields per project, which puts a practical ceiling on how much structured data you can actually track per item regardless of how many items you’re allowed to create.
| Platform | Real ceiling | Per | Notes |
|---|---|---|---|
| Blue (Enterprise) | 1,000,000 | workspace | |
| Airtable (Enterprise Scale) | 250,000 | table | headline figure is 500,000/base, across multiple tables |
| Monday.com (Enterprise) | 100,000 | board | only tier above the 10,000 ceiling every other plan shares |
| ClickUp (all paid tiers) | 50,000 | list | unchanged from free tier through Enterprise |
| Trello (all tiers) | 5,000 | board | lowest ceiling in the comparison, including Enterprise |
| Asana | no published cap | project | but hard-capped at 150 custom fields/project |
(Figures as published on each platform’s pricing and help pages at time of writing.)
Setting numbers that would actually mean something
Once I had the real numbers in front of me, the target was obvious: match or beat every competitor’s real ceiling, at every one of Blue’s tiers — not just at the top.
| Tier | Records per workspace | Custom fields per workspace |
|---|---|---|
| Starter | 50,000 | 100 |
| Pro | 500,000 | 500 |
| Enterprise | 1,000,000 | Unlimited |
A few of these are worth spelling out. Starter — Blue’s entry-level paid plan — already matches ClickUp’s ceiling at every tier they offer, and beats Monday.com’s paid Standard and Pro tiers 5x over, and Trello’s cap at any tier 10x over. Pro’s 500,000 doubles Airtable’s real per-table ceiling, even though it only ties their headline per-base number. Enterprise’s 1,000,000 doubles Airtable’s headline number and is ten times Monday’s top tier — no competitor comes close, at any tier, at any price.
A number is only real if the product can back it up
Changing a config value to raise a limit takes minutes. Actually supporting that many records — loading a workspace, editing it, running automations against it, exporting it — is a different question entirely, and it’s the one that actually matters to a customer who takes me up on it.
So before shipping any of the numbers above, I built a synthetic “Scale Test” workspace inside Blue’s own account and populated it with real data at the target scale: hundreds of thousands of records, hundreds of custom fields, the same mix of field types — text, numbers, dates, lookups into other records, computed rollups — that real customer workspaces actually use. Then I put every part of the product through its paces against it, watching production infrastructure the whole time.
The database side held up well. A few targeted fixes earlier in the year — an optimizer threshold that made MySQL choose a worse query plan on very large batch lookups, a join order that mattered more than expected, pacing on background job fan-out so a single large edit couldn’t flood the queue — meant that by the time I ran the scale test, workspaces already running at 100,000+ records in production showed flat CPU and disk usage. The database was ready.
What I hadn’t yet proven was the part a customer actually feels: does opening a workspace with hundreds of thousands of records feel fast, or does it feel like the product just gave up.
Making a 50,000-record workspace load in seconds, not minutes
Blue’s frontend loads a workspace in three phases — lean fields first (enough to render something on screen), then custom field values, then checklists — paginating through the workspace in small batches. That’s a fine design for a workspace with a few hundred records. At the scale I was now testing against, it broke down: each of those hundreds of small requests pays the same fixed overhead — parsing, permission checks, request setup — regardless of how little data it’s carrying. I measured a steady 300-400 records per second on my largest test workspace, with no sign of slowing and no sign of finishing.
The fix was architectural: replace the pagination with a single streaming connection. A dedicated route opens a real database cursor and writes results to the browser as they’re produced, instead of the browser asking for one page at a time.
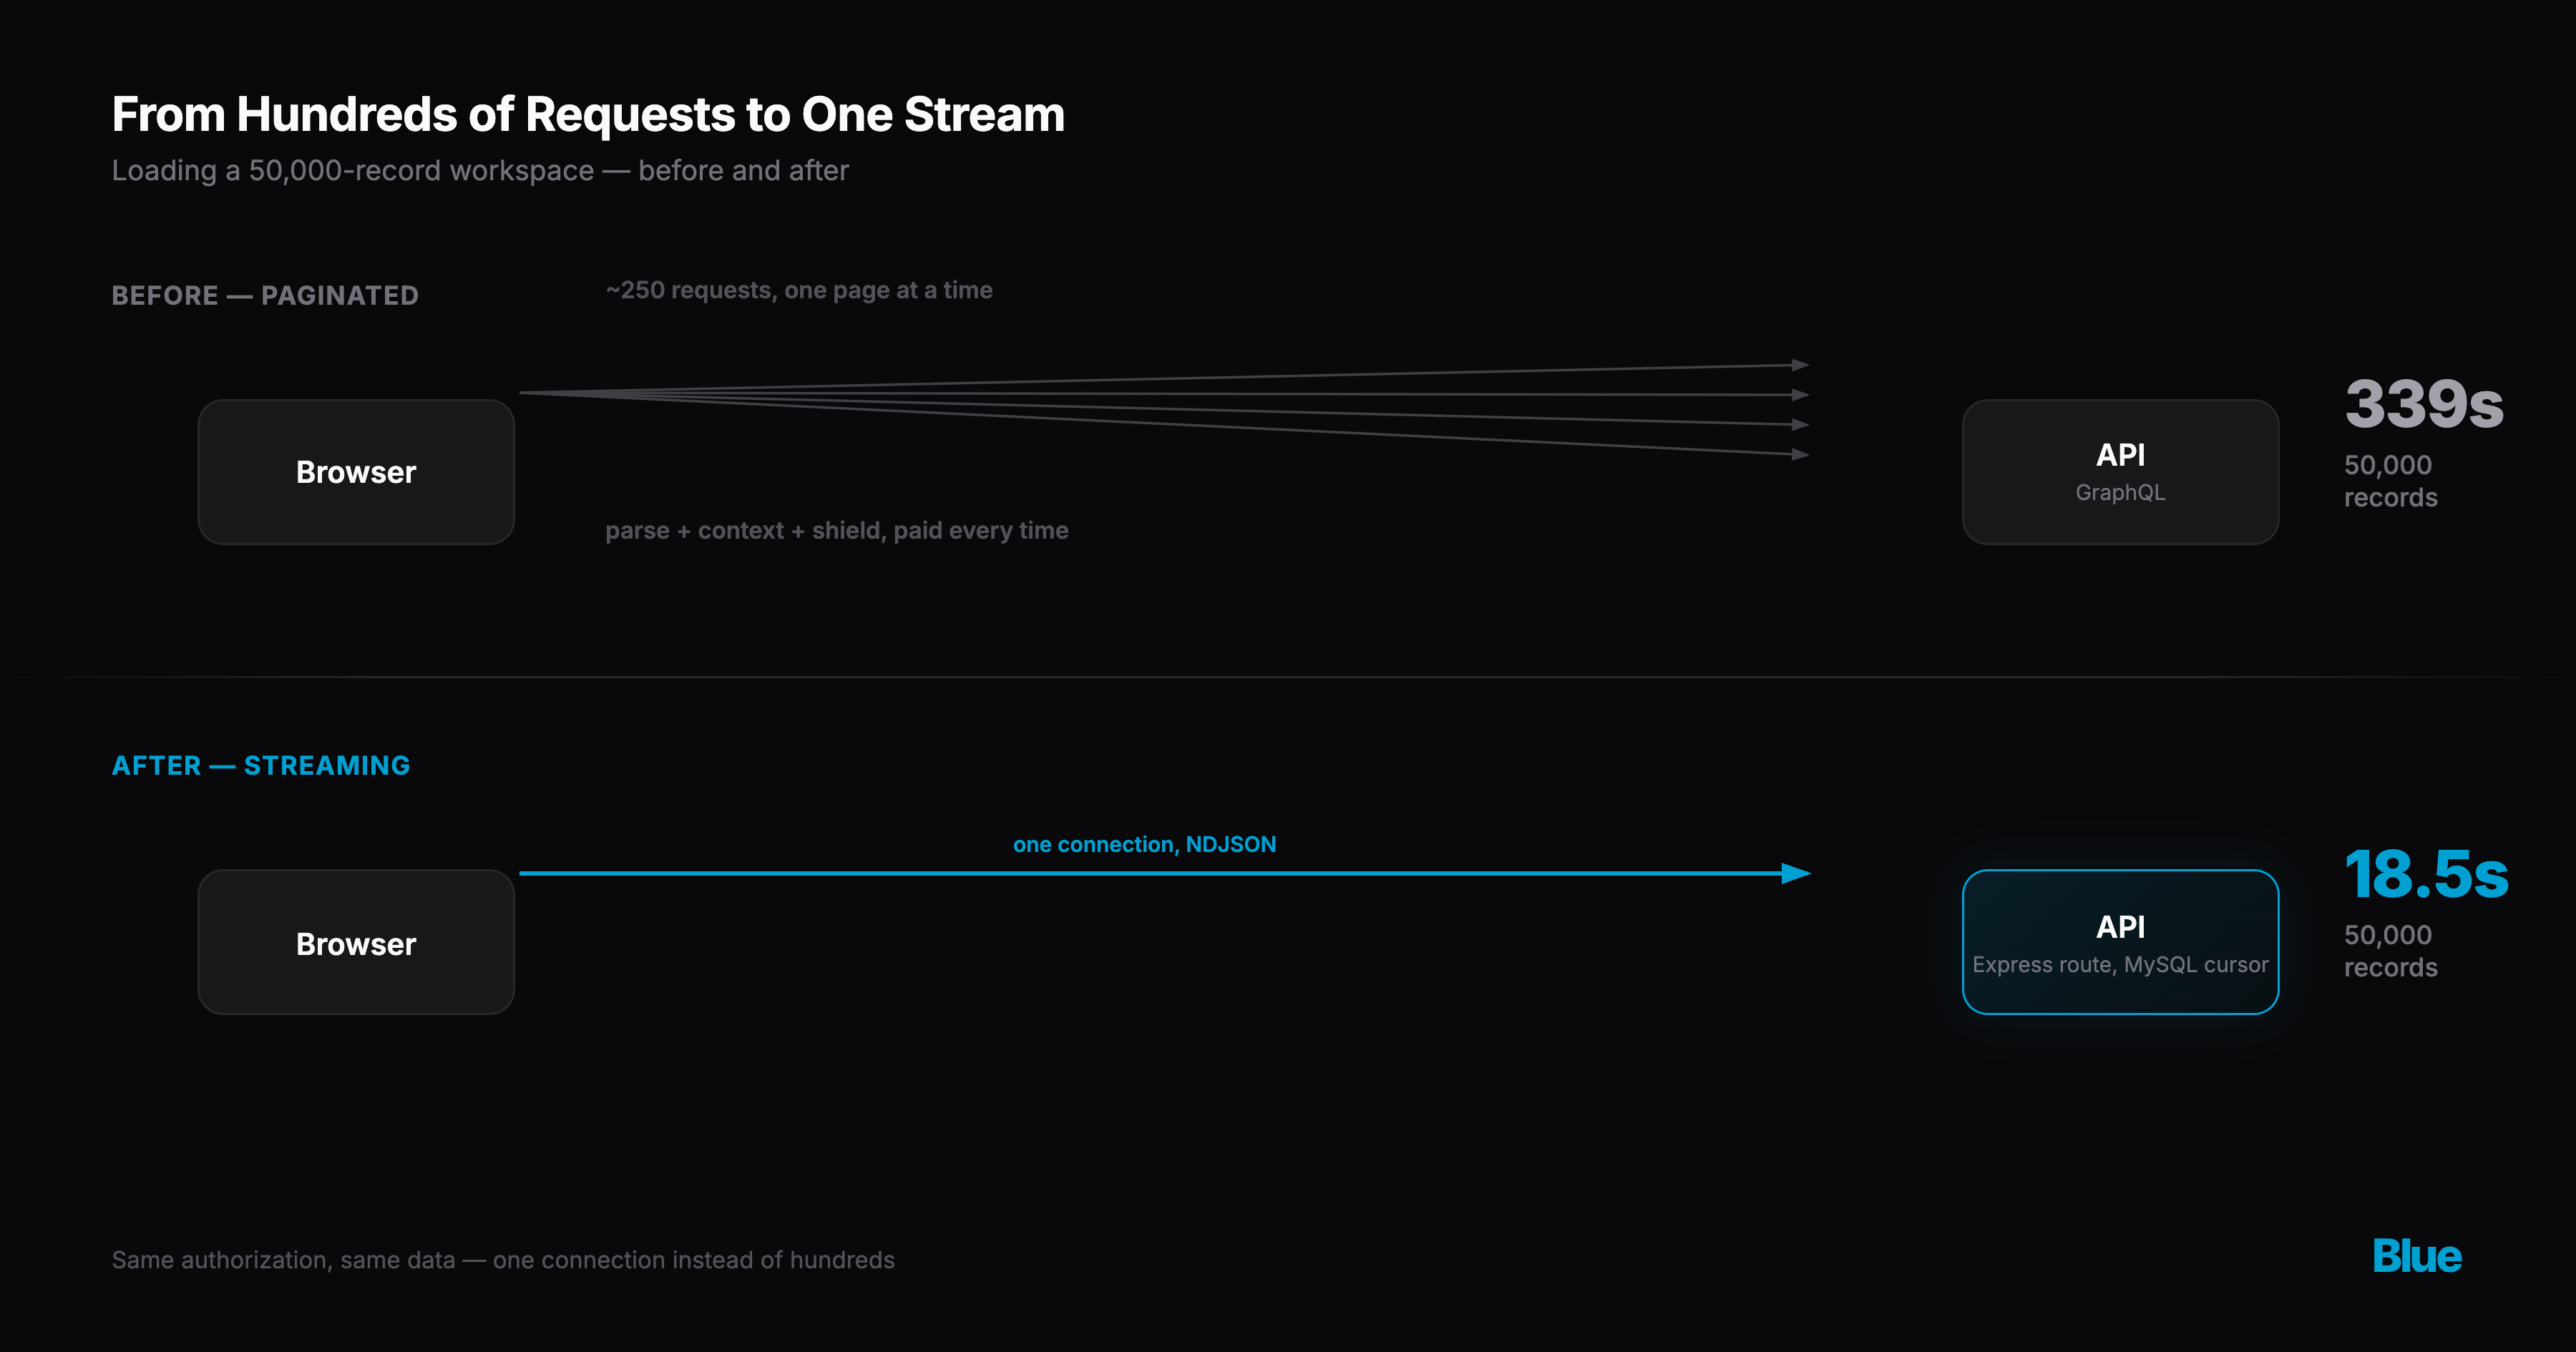
For lean fields, this took a 50,000-record workspace from “still running after nearly two minutes” to 8 seconds.
Custom field enrichment — the phase that fills in every column’s actual value — was the harder, heavier problem. It’s also the phase that determines whether “500,000 records” is a number a workspace can actually live at, since it’s where the bulk of the real data lives: lookups, computed rollups, every custom field type a workspace has configured.
I built the same streaming architecture for it. Then I didn’t stop at the first working version — I measured it against the same 50,000-record test workspace, round after round, until the result was one I’d trust putting in front of a customer at the new limits.
| Round | What changed | Time (50k records) | Cumulative |
|---|---|---|---|
| Baseline | Paginated requests | 339s | — |
| 1 | Streaming architecture | ~62s | 5.5x |
| 2 | Tightened the response shape | ~29s | 11.7x |
| 3 | Cached field-level lookups | ~23s | 14.7x |
| 4 | Right-sized the batch dispatch | ~18.5s | 18.3x |
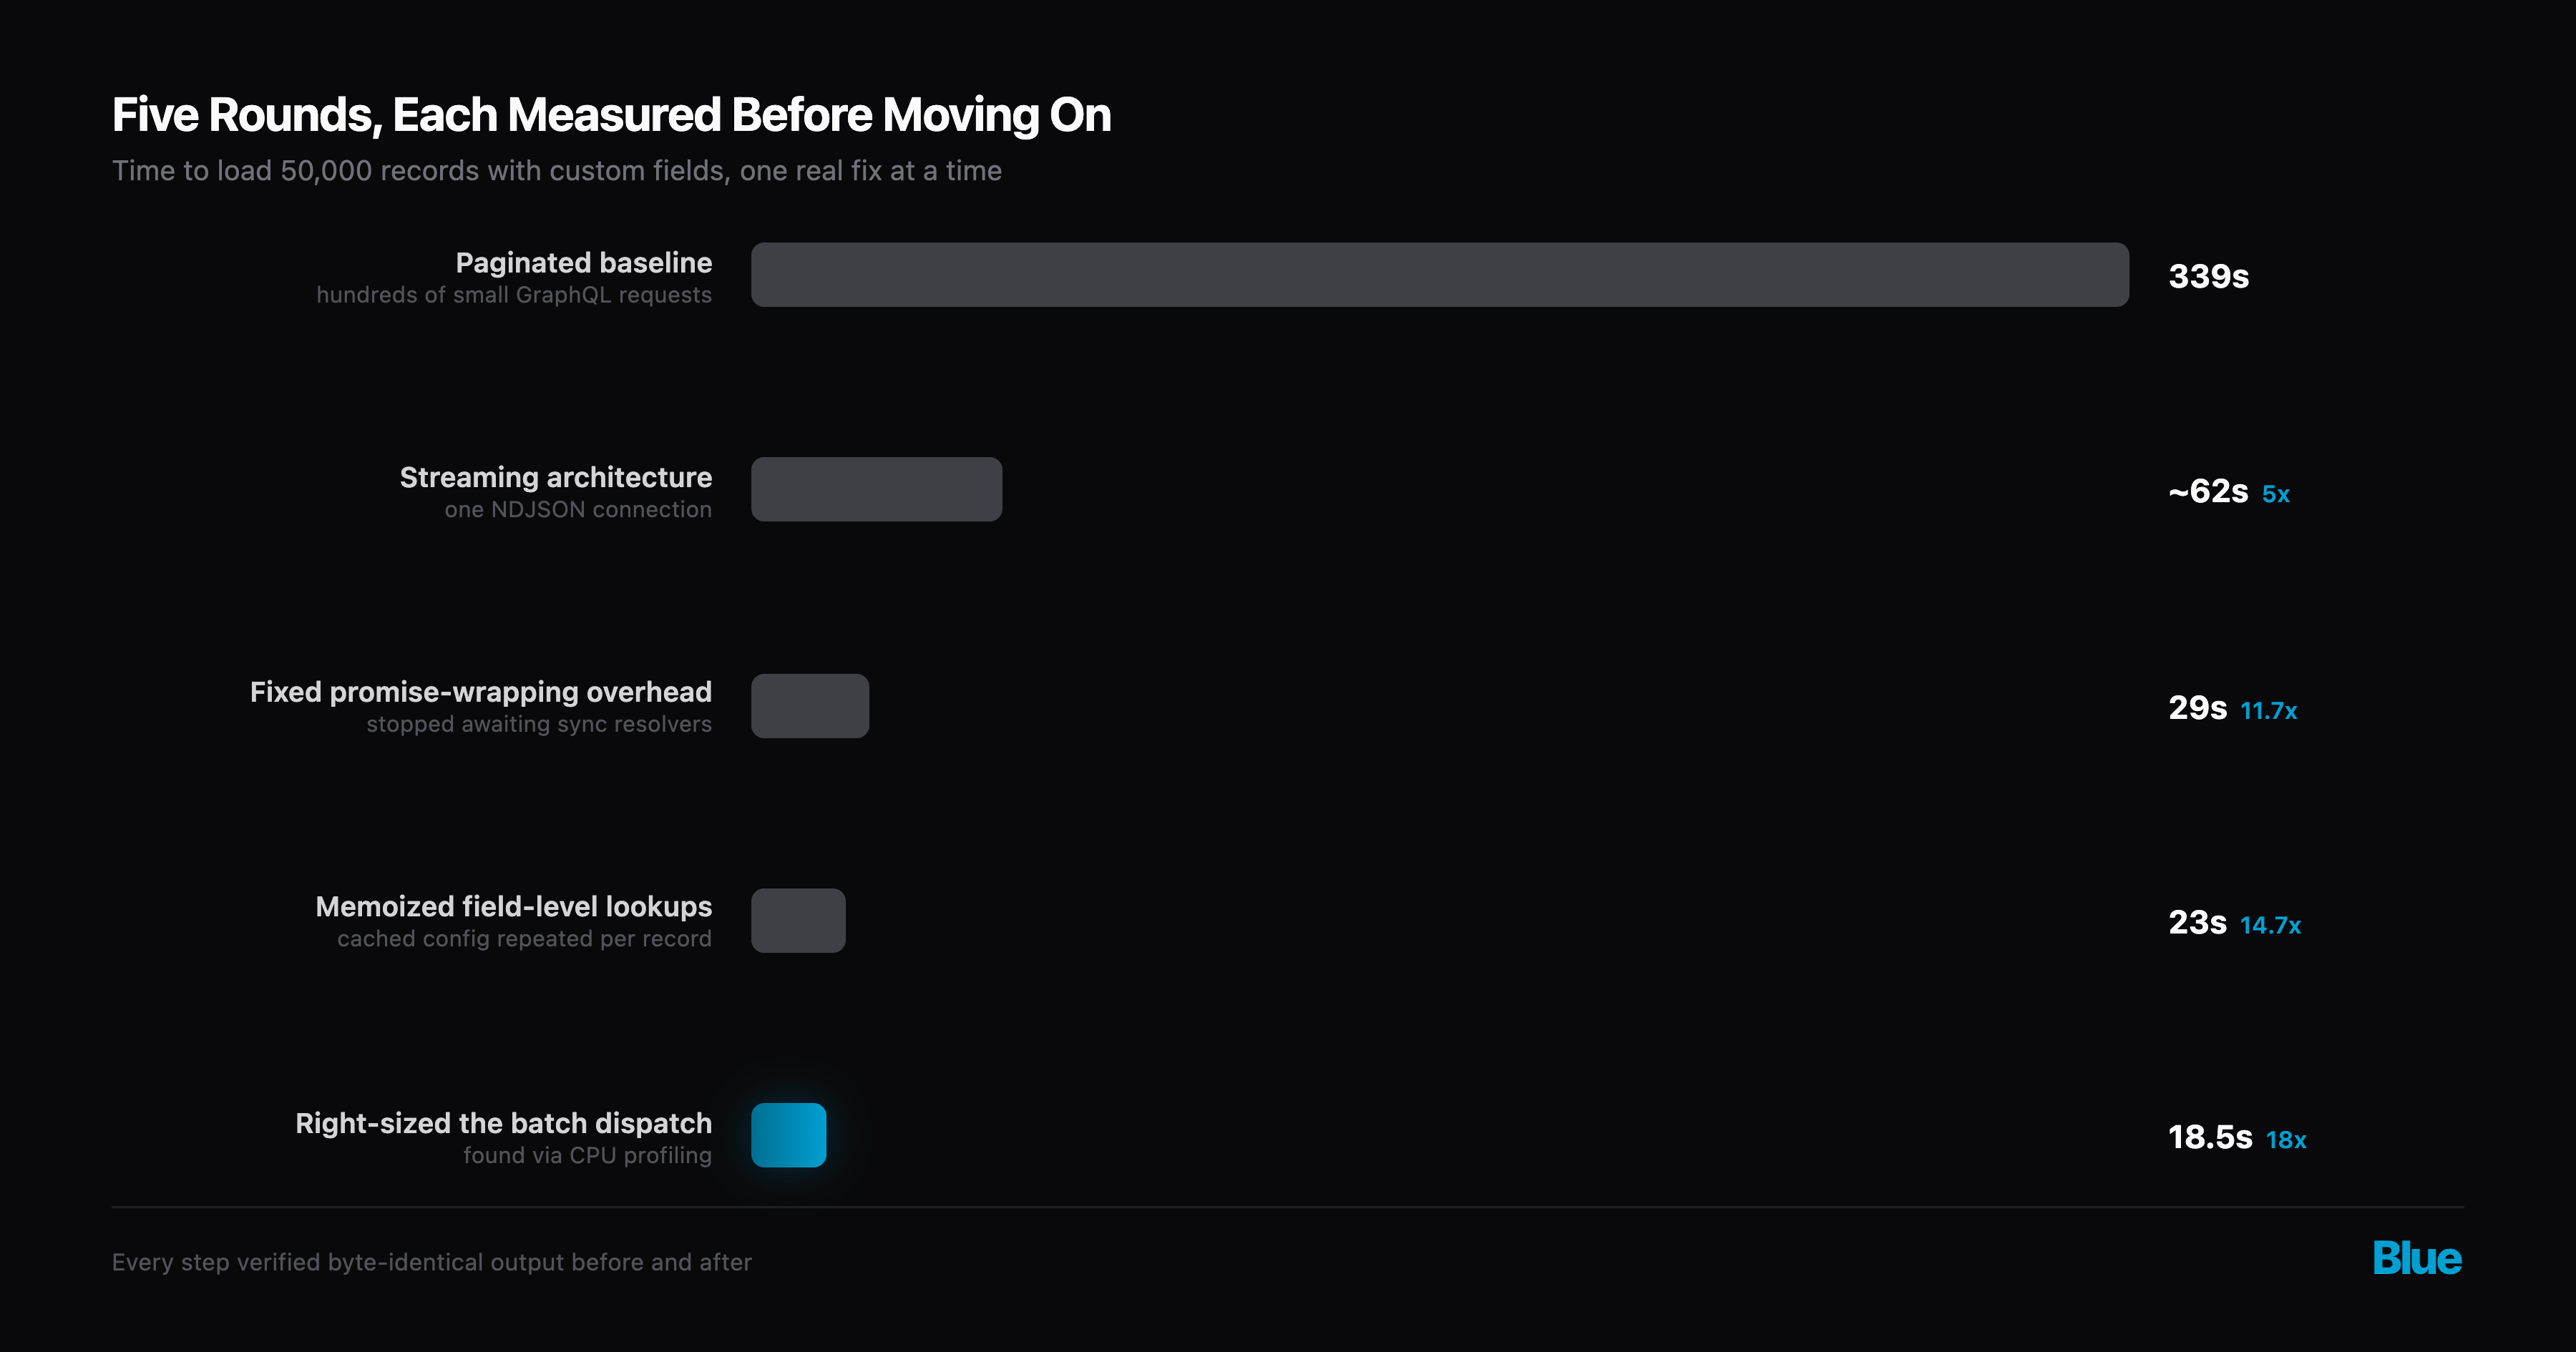
The middle rounds are where the profiling got interesting. After the architecture change alone only delivered 5.5x — not the dramatic win the first phase had gotten me used to — I went looking for why with an actual V8 CPU profile of the request, rather than guessing. I expected a thread busy resolving fifty custom fields per record. Instead:
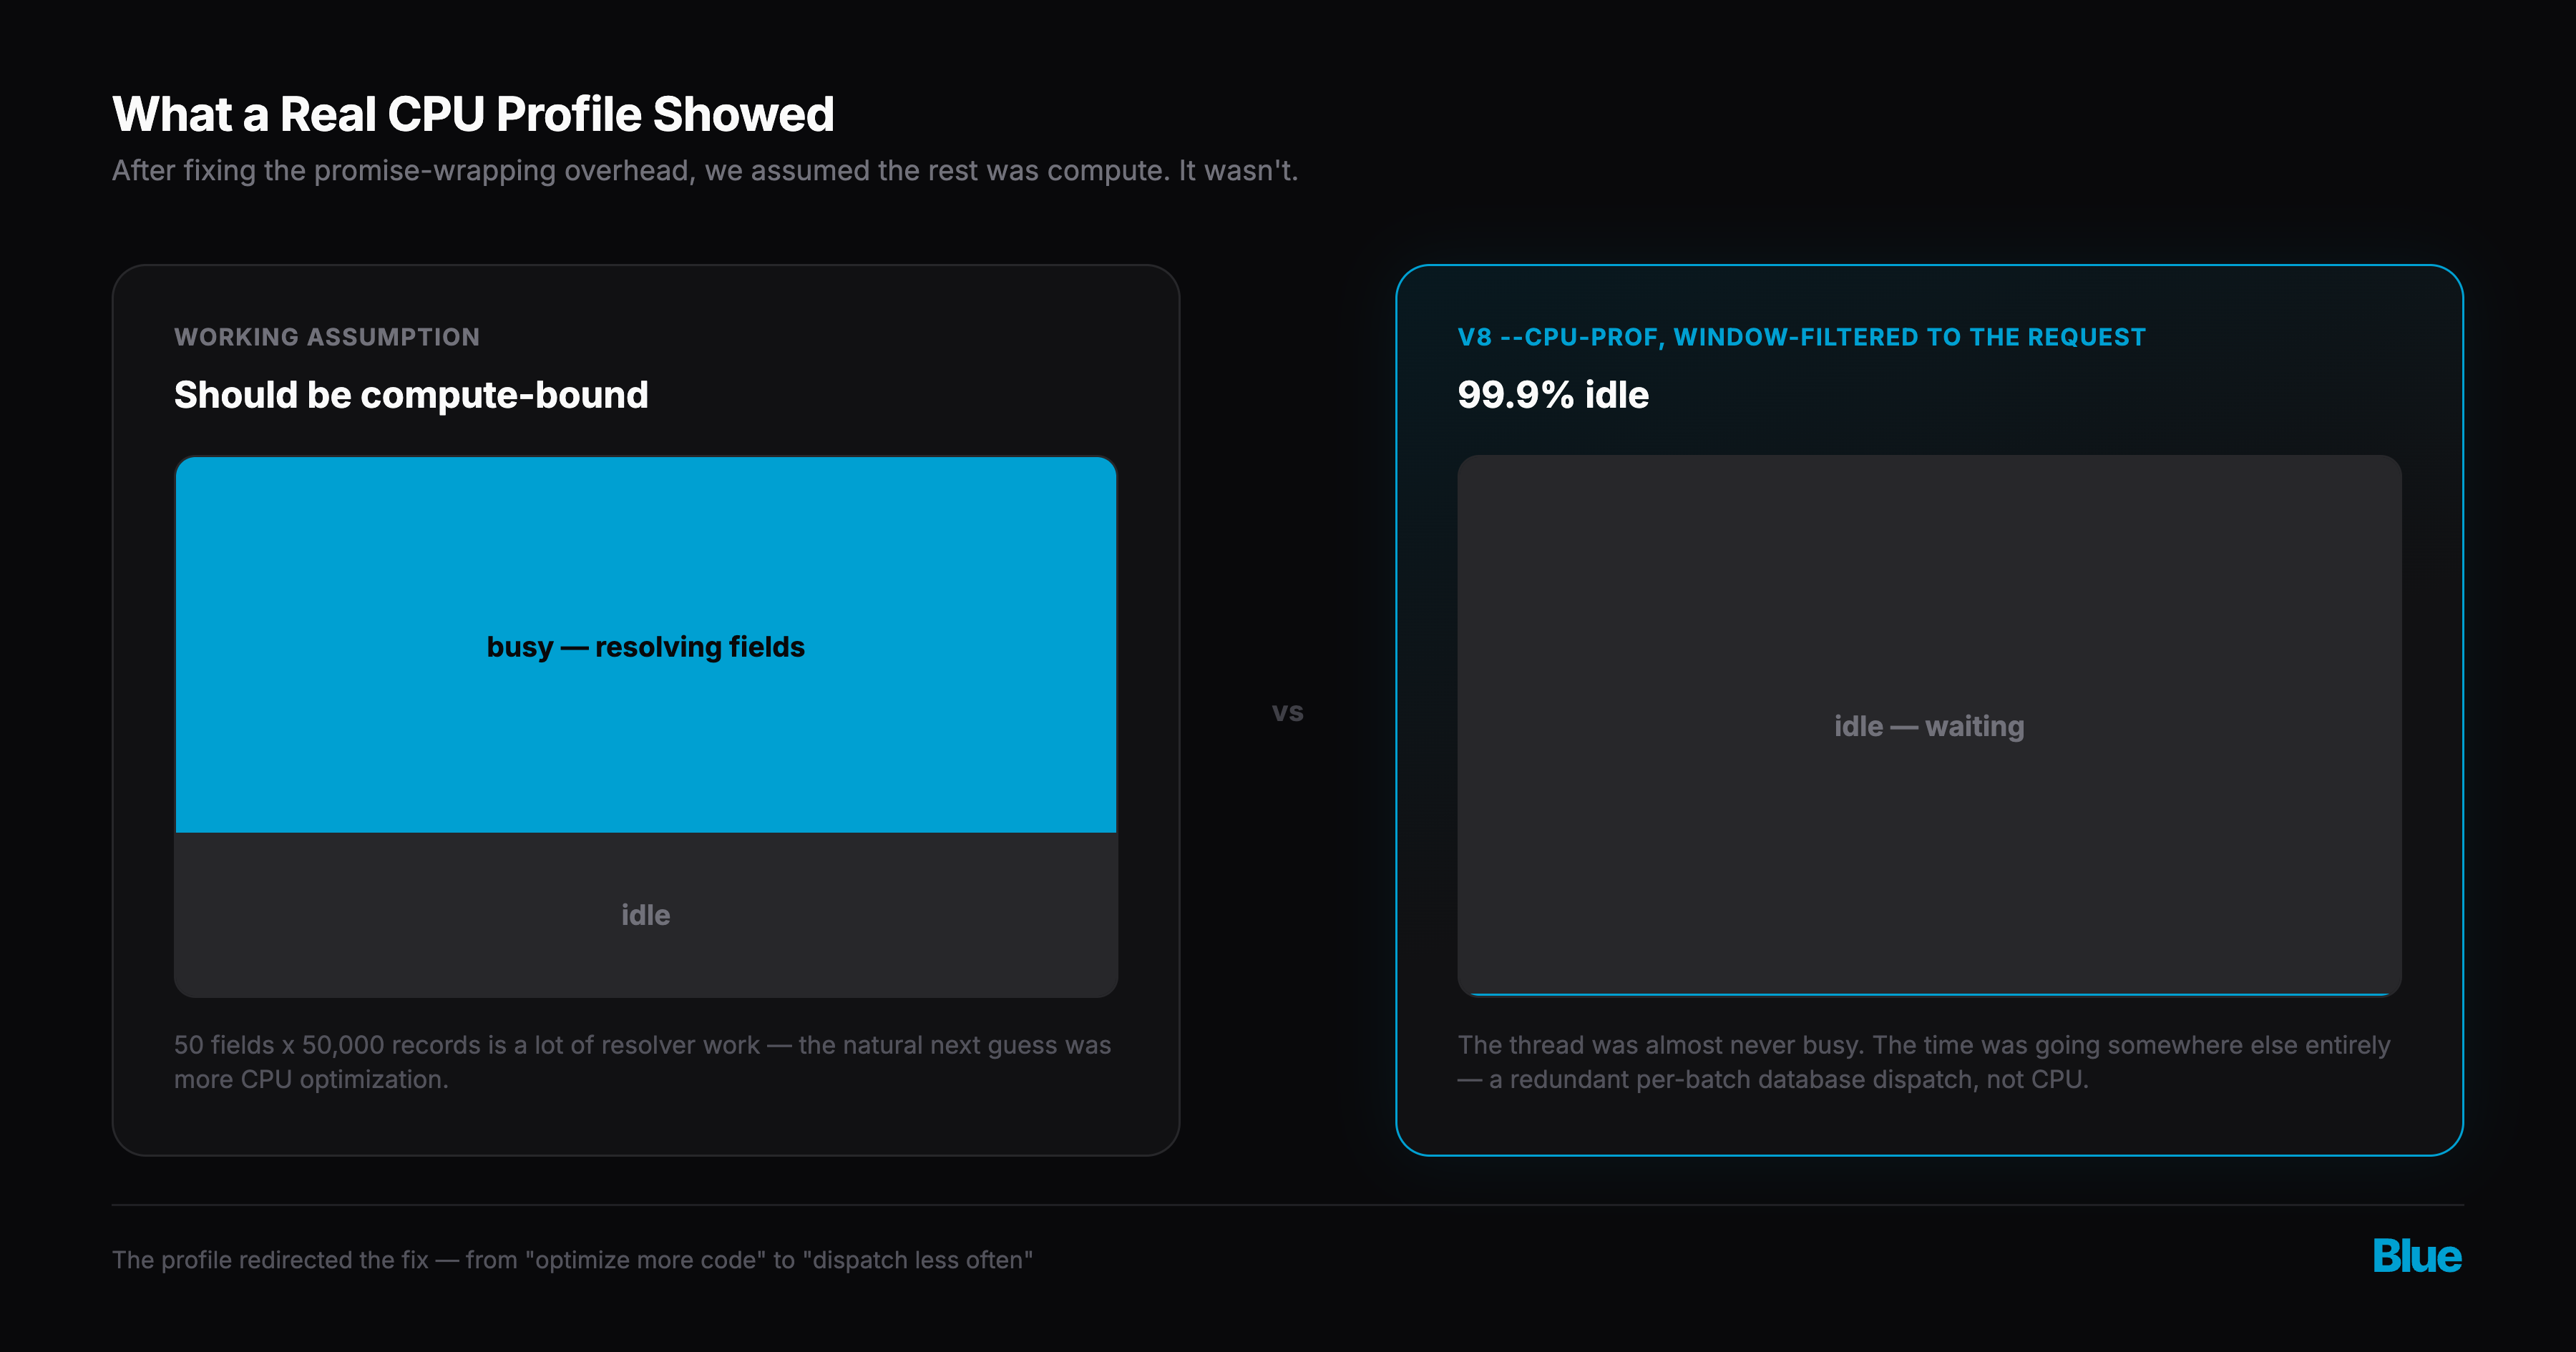
The thread was idle 99.9% of the time. That number sent the investigation somewhere I hadn’t expected — not toward optimizing more code, but toward finding what it was actually waiting on. Two things turned up: field values were being resolved through more asynchronous overhead than the work required, and the database was being asked for the same unchanging, workspace-level configuration on every single batch of a request instead of once. Fixing both — plus one more round tuning exactly how many records get batched together per round-trip — is what took the number the rest of the way down.
I tested pushing the batch size further, past the point that helped, and stopped. There’s a limit one layer below this one, in how the database driver batches its own lookups, that exists specifically to stay under a MySQL query-planner threshold — cross it, and the planner can decide a full table scan is cheaper than an index lookup on a multi-million-row table. That’s not a number to move casually on the strength of one test workspace; it needs its own investigation against real production data, on its own timeline.
What this means
The numbers on Blue’s pricing page now aren’t aspirational. I picked them by looking honestly at what every competitor actually allows, set out to beat all of them, and then did the work — database fixes proven against real production traffic, a streaming rewrite proven against a purpose-built scale test, four rounds of measured tuning — to make sure a workspace at those limits is something I’ve already watched work, not something I’m hoping will.
If your process has outgrown a 5,000-card Trello board or a 50,000-row ClickUp list, there’s now meaningfully more room in Blue than anywhere else I compared myself against — at every tier, starting with Starter.
— Manny