'%20fill='%23fff'%3e%3cpath%20d='M24%20364.337V24h141.909c25.481%200%2046.833%203.601%2064.056%2010.803%2017.222%207.191%2030.183%2017.279%2038.882%2030.24s13.049%2027.972%2013.049%2045.041c0%2012.961-2.72%2024.513-8.148%2034.645-5.429%2010.142-12.906%2018.534-22.431%2025.174-9.526%206.651-20.548%2011.299-33.069%2013.953v3.325c13.732.661%2026.451%204.383%2038.134%2011.134%2011.684%206.762%2021.077%2016.155%2028.168%2028.17%207.092%2012.025%2010.638%2026.231%2010.638%2042.628%200%2018.281-4.647%2034.601-13.952%2048.939-9.305%2014.35-22.762%2025.648-40.381%2033.908-17.607%208.248-38.992%2012.377-64.143%2012.377H24zm82.258-200.414h45.534c8.975%200%2016.947-1.497%2023.929-4.493s12.432-7.312%2016.374-12.961c3.931-5.65%205.902-12.466%205.902-20.439%200-11.409-4.041-20.384-12.135-26.926-8.082-6.53-18.995-9.801-32.738-9.801h-46.866v74.62zm0%20134.109h50.853c17.839%200%2030.987-3.381%2039.466-10.131%208.479-6.762%2012.708-16.178%2012.708-28.247%200-8.755-2.049-16.309-6.145-22.686-4.096-6.365-9.922-11.298-17.443-14.789-7.532-3.491-16.561-5.231-27.089-5.231h-52.339v81.095l-.011-.011zM388.865%2024v340.337h-81.256V24h81.256zm181.618%20230.159V109.082h81.091v255.255h-77.435v-47.529h-2.665c-5.649%2015.616-15.263%2028.004-28.829%2037.145-13.578%209.14-29.941%2013.71-49.102%2013.71-17.398%200-32.683-3.986-45.864-11.97-13.181-7.973-23.433-19.14-30.745-33.489s-11.023-31.165-11.133-50.437V109.082h81.256v146.739c.11%2013.854%203.766%2024.767%2010.968%2032.74s17.002%2011.96%2029.413%2011.96c8.082%200%2015.372-1.795%2021.847-5.407%206.486-3.601%2011.628-8.865%2015.45-15.781%203.821-6.927%205.737-15.318%205.737-25.174h.011zm224.376%20115.002c-26.704%200-49.718-5.286-69.044-15.869-19.337-10.583-34.181-25.703-44.532-45.371-10.362-19.668-15.537-43.069-15.537-70.215s5.208-49.445%2015.614-69.212c10.418-19.779%2025.096-35.174%2044.037-46.197s41.261-16.53%2066.962-16.53c18.17%200%2034.787%202.83%2049.851%208.48s28.08%2014.007%2039.048%2025.086%2019.501%2024.734%2025.591%2040.966%209.14%2034.81%209.14%2055.756v20.273H694.145v-47.199h146.226c-.11-8.633-2.159-16.342-6.145-23.104s-9.448-12.047-16.374-15.869-14.866-5.726-23.841-5.726-17.233%202.015-24.424%206.057c-7.202%204.052-12.906%209.537-17.112%2016.452-4.207%206.927-6.431%2014.757-6.652%2023.512v48.025c0%2010.417%202.049%2019.525%206.145%2027.332s9.911%2013.876%2017.454%2018.193c7.532%204.317%2016.506%206.486%2026.924%206.486%207.201%200%2013.731-1.002%2019.612-2.995%205.869-1.993%2010.912-4.923%2015.119-8.81%204.206-3.876%207.367-8.645%209.47-14.294l74.616%202.158c-3.105%2016.728-9.889%2031.264-20.361%2043.62s-24.182%2021.937-41.129%2028.743c-16.947%206.816-36.559%2010.219-58.825%2010.219l.011.033z'/%3e%3c/g%3e%3cdefs%3e%3cclipPath%20id='A'%3e%3cpath%20fill='%23fff'%20transform='translate(24%2024)'%20d='M0%200h892v345.161H0z'/%3e%3c/clipPath%3e%3c/defs%3e%3c/svg%3e)
Leaderboards
Rank groups by their exact values in a sorted table instead of a plotted chart.
A leaderboard lists every group in a chart from highest value to lowest and shows the exact number for each one. Use it when the figure is the answer — who is carrying the most work, which workspace closed the most records, which tag comes up most often — rather than the shape of the data over time.
A leaderboard is a presentation style of the bar graph, so it shares the entire bar-graph builder: every group-by field, measures and aggregations, and filters work the same way.
Create a leaderboard
- Open a dashboard.
- Select Add chart > Leaderboard.
- Enter a title.
- Under Group by, select the field that defines the rows. You can group by assignee, tag, list, status, date, workspace, or a supported custom field.
- Under Measure, select Records to count records or select a numeric custom field, then choose its aggregation.
- Select Add filters if you need to limit the records in the chart.
- Under Display as, select Number, Percentage, or Currency.
- Select Create.
You can also open an existing bar, line, or area graph and switch it to a leaderboard with the Bar / Line / Area / Table toggle.
What each row shows
Every row carries four things:
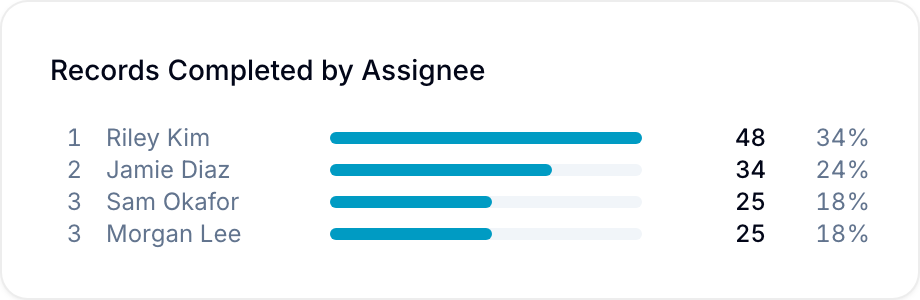
- Its rank. Groups with the same value share a rank, and the next rank skips the positions they take up.
- Its label — the group’s name. Hover a shortened label to read it in full.
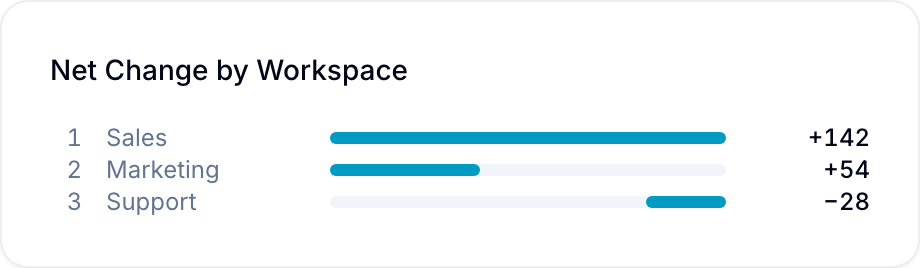
- A bar, sized against the highest value in the chart, so the rows stay comparable at a glance.
- Its value, in full. Unlike an axis label, a leaderboard never abbreviates a number.
When every value is zero or above, a final column shows each row’s share of the total.
How many groups are listed
By default a leaderboard shows all its groups, however many there are. Long lists scroll inside the card.
To keep only the highest-ranked rows, set Limit in the chart builder — Top 5, Top 10, Top 20, Top 50, or any number from 1 to 200. A leaderboard ranks by value on its own, so the limit is available without setting a sort order first. When rows are left out, the card shows Showing top N of M below the rows. See showing only the top groups.
You can also narrow a long leaderboard with a filter, or group by a field with fewer values.
Cross-filtering
Select a row to filter every other chart on the dashboard by that group, the same as selecting a bar or a pie slice. See cross-filtering.
Breakdowns
A leaderboard cannot be broken down into segments. One row per group is the whole format, so there is nowhere to put a second grouping dimension. Use a stacked bar or area chart when you need to show what each group is made of.
Export
Open the chart menu and select Export. Blue emails you a CSV of the records behind the chart — every record the leaderboard counted, not the ranked rows themselves.
Edit a leaderboard
Open the chart menu and select Edit. You can change any setting, including switching the chart back to bars, a line, or an area.