Creating Reports
Create a report with workspace data sources, saved filters, selected columns, and optional numeric summaries.
A report displays selected fields of records from one or more workspaces. It includes records from every database in those workspaces. Reports require Pro or Enterprise.
Create a Report
- Open Analytics in the organization sidebar, then select Reports.
- Select Create report.
- Enter a Title.
- Optional: Enter a Description that explains the report’s contents or purpose.
- Configure at least one data source.
- Add at least one column.
- Select Create. Blue opens the new report.
Configure Data Sources
A data source defines which workspaces and records the report includes. Select one scope for the report:
- All workspaces: Includes every active workspace in the organization. It also includes workspaces added later.
- Specific workspaces: Includes only the workspaces that you select.
Each person who opens the report sees only the records and fields that their own workspace roles allow. Two people can see different rows in the same report.
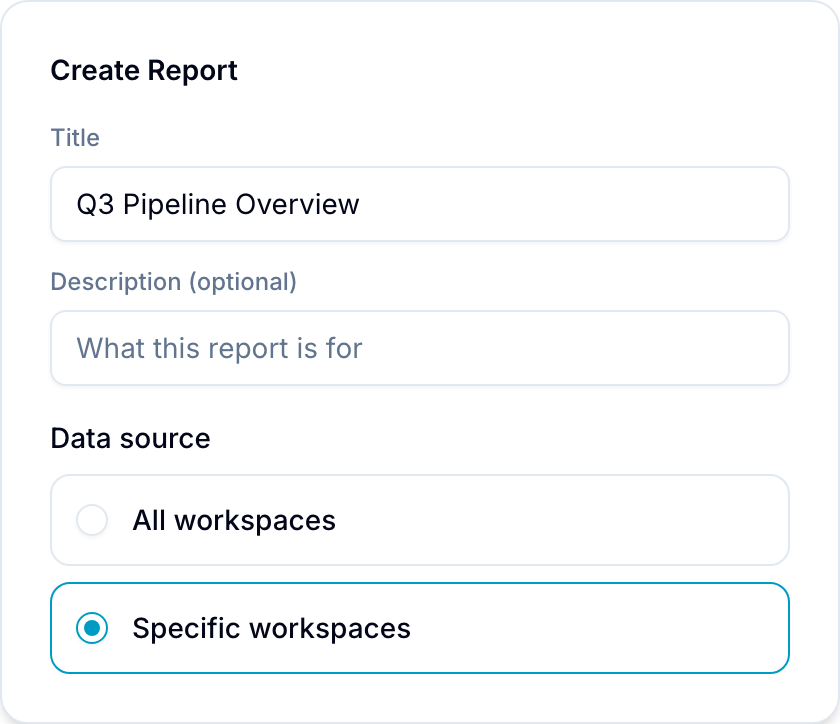
You cannot combine All workspaces and Specific workspaces in one report. If you add several specific data sources, each workspace can belong to only one source.
Use separate specific data sources when different workspace groups need different filters.
Add Saved Source Filters
Each data source can have its own saved filters.
- Select Add filters in the data source.
- Add field, operator, and value rules.
- Add groups and choose AND or OR logic as needed.
Filters can use record fields, dates, and completion state. See Filters for filter behavior.
Select Columns
Select Add column and choose fields from these groups:
- Default Fields: Title, Database, Due Date, Projects, Assignee, Tags, Created at, Updated at, Completed at, Last updated by, Blocked By, and Blocking. Database shows the database that contains the record. Projects shows its workspace.
- Custom Fields: Fields from the databases in the selected workspaces. A field that several databases share appears once.
Drag selected columns to change their saved order. For a supported numeric column, you can also select a summary operation.
After you open the report, drag a column boundary to resize it. Use the column menu to pin supported columns.
Edit a Report
- Open the report menu.
- Select Edit.
- Change its title, description, data sources, filters, columns, or summaries.
- Select Save. Blue applies the saved configuration to everyone with access.
Use the Report Table
- Select a record title to open the source record.
- Right-click a row and select Open in new tab or Copy.
- Select a sortable column heading to change the table order.
- Select Filter to apply temporary filters. Temporary filters do not change the saved report configuration.
- Scroll to load more records. The table shows up to 5,000 records.