Timeline & Gantt Charts

Schedule records on a Gantt-style timeline, group them into lanes, and review dependencies and critical paths.


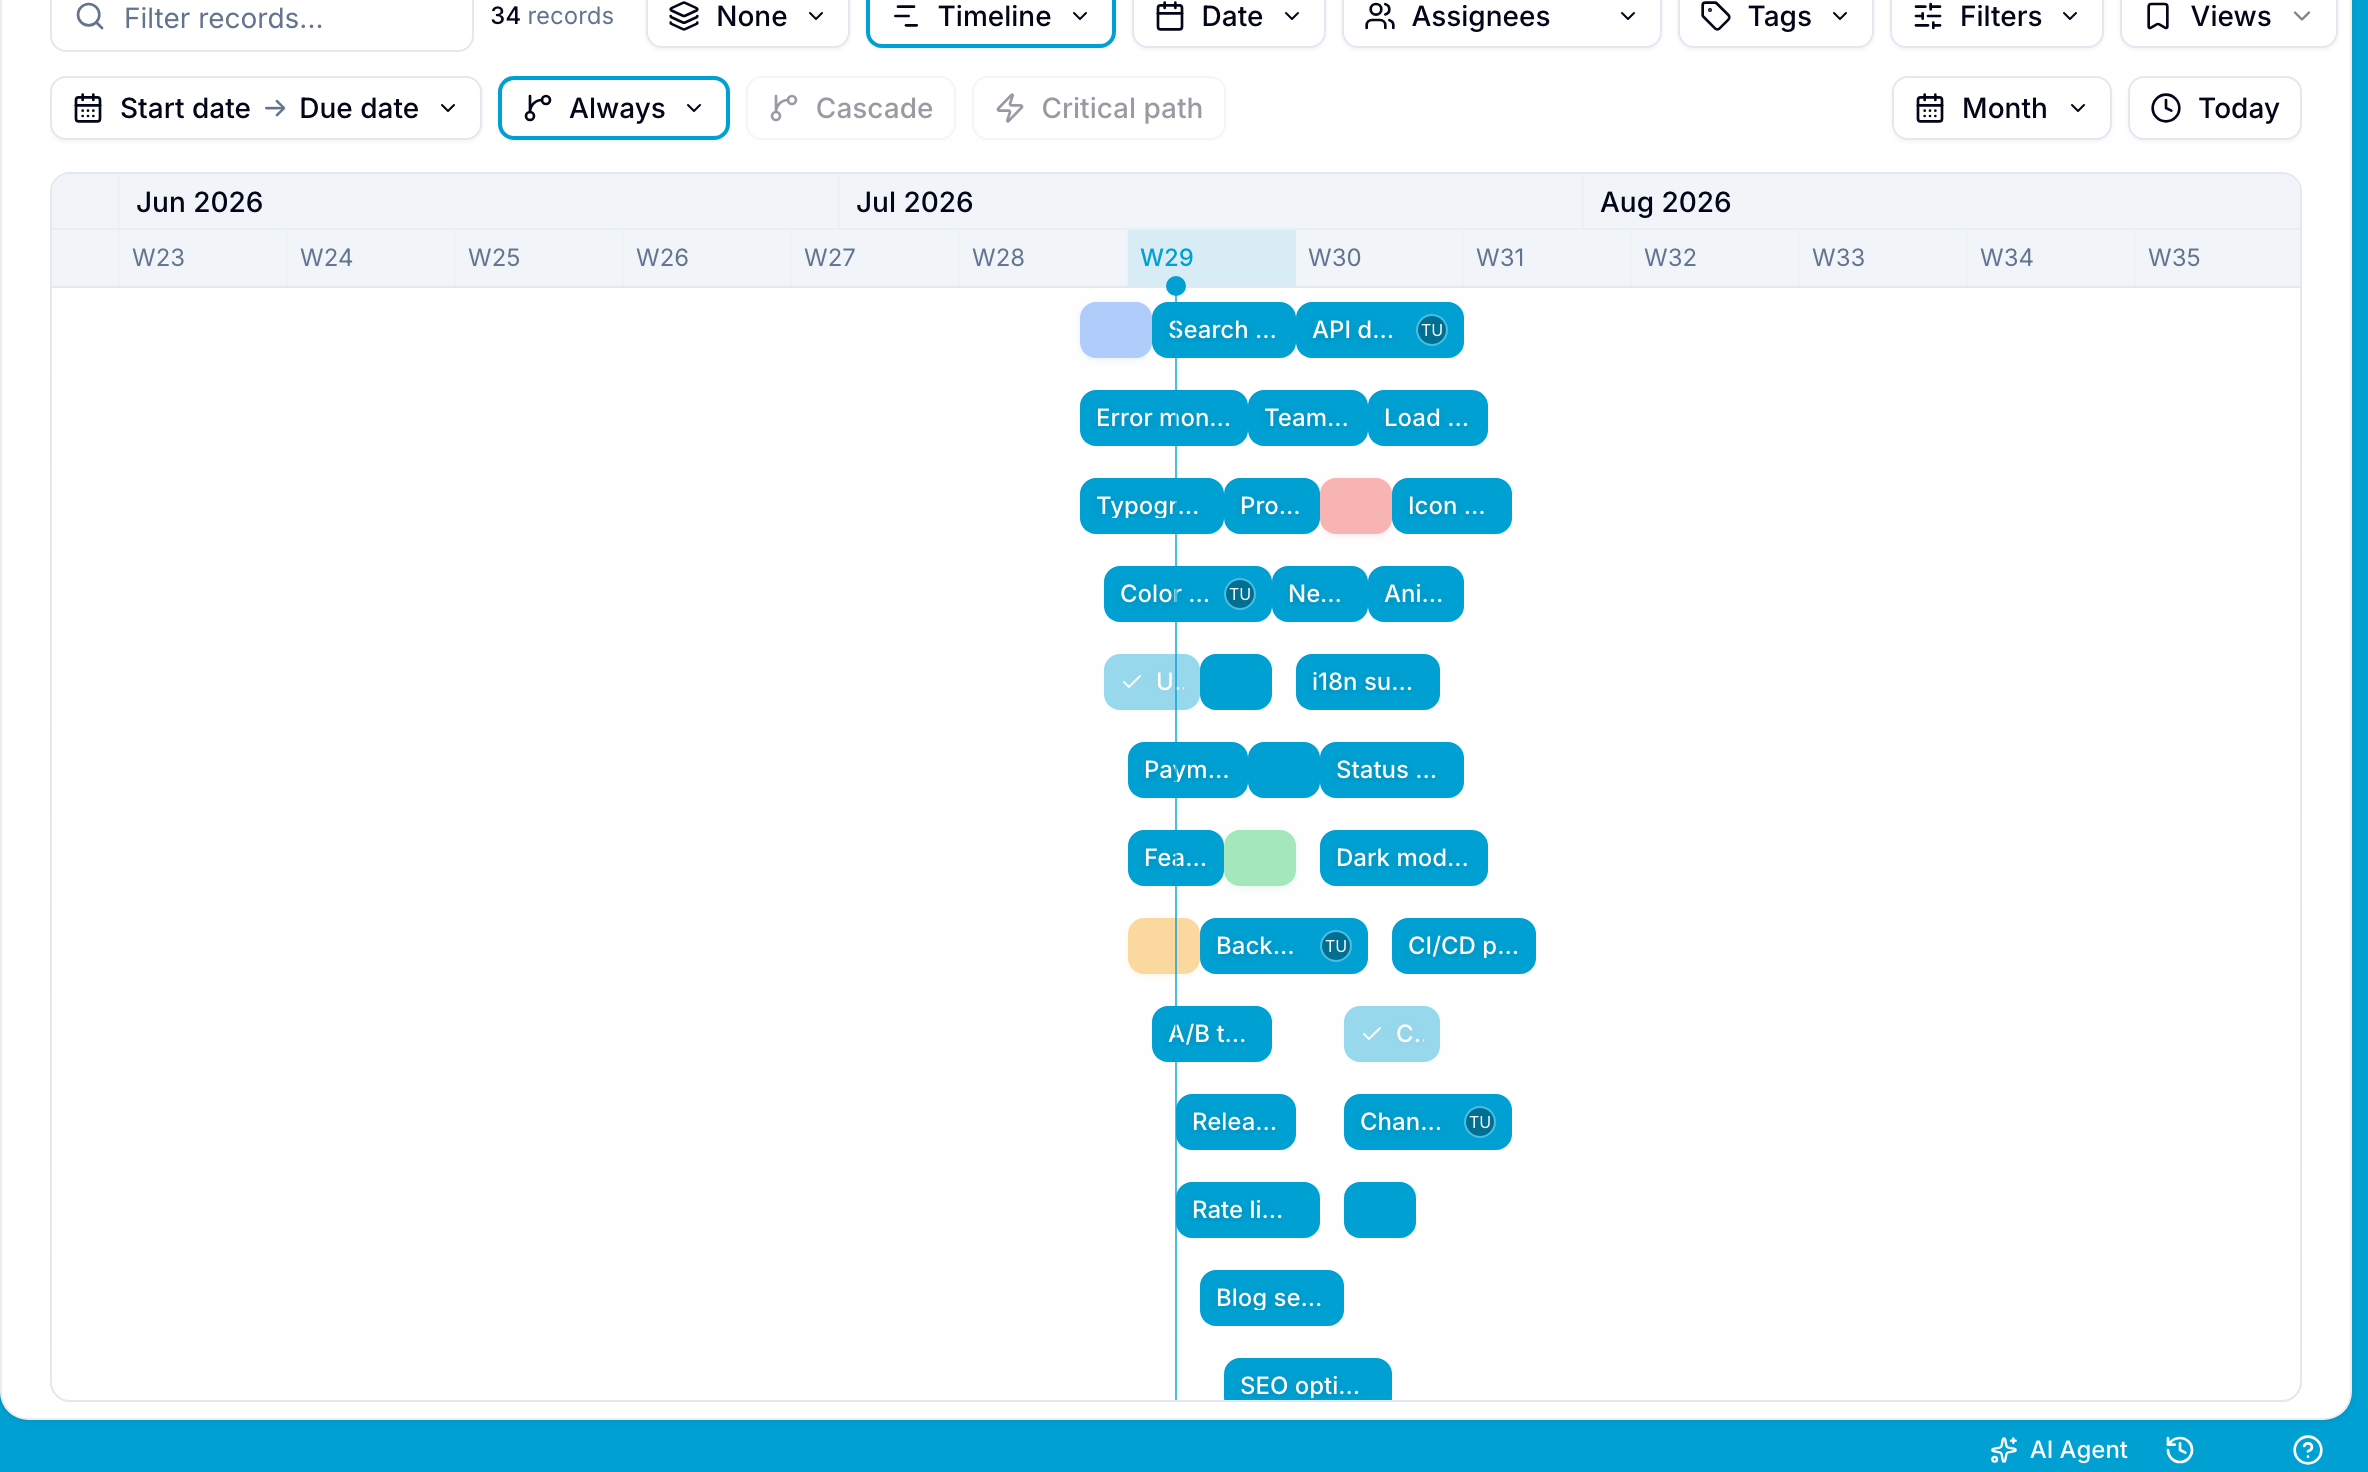
The Timeline view displays dated records as bars on a horizontal calendar. A bar’s position and length represent the record’s dates and duration.

Drag bars to reschedule records, resize bars to change durations, and display dependency arrows between related records.

Timeline view with record bars laid out on a horizontal date canvas

Use the Timeline view to:

  • Plan project schedules, milestones, and deadlines.
  • Review overlapping work.
  • Review dependency chains that reach the latest due date.
  • Review which records block other records.
  • Compare workload across a team or project.

Change the zoom level

Select the zoom control in the upper-right toolbar, then select one of five levels:

LevelBest for
DayDetailed scheduling of tasks within a week
WeekSprint planning and short-horizon tracking
MonthMonthly planning and release roadmaps
QuarterQuarterly OKRs and cross-team planning
YearAnnual roadmaps and long-range strategy

To zoom without moving your current position, hover over the canvas and use Ctrl + scroll. On Mac, use + scroll.

Return to today

Select Today to center the timeline on the current date.

Scroll through time

The timeline extends in both directions. When you scroll near an edge, Blue adds more dates automatically.

Use this continuous range to schedule future records or review past records.

Configure record dates

The Timeline view needs a start source and an end source. By default, Start date uses each record’s Start date, and End date uses its Due date.

Select the calendar icon in the toolbar to change either source.

  • The start source can use Start date, Created date, Due date, Last updated, Completed at, or a custom Date field.
  • The end source can use Due date, Start date, Last updated, Completed at, or a custom Date field.

When Created date is the start source, you cannot drag the bar’s left edge.

Blue does not show a record if it has no value for the selected start or end field.

The selected sources control which dates Blue displays. Dragging and resizing always change the built-in Start date and Due date fields.

Select the default Start date and Due date sources before you reschedule records with drag and drop.

Schedule records with drag and drop

Move a record

With the default date sources selected, drag the body of a bar left or right. Blue changes its built-in start and due dates by the same amount.

Resize a record

Drag the right edge of a bar to change its built-in due date. Drag the left edge to change its built-in start date.

You cannot drag the left edge when Created date is the start source.

Move multiple records

  1. Hold on Mac or Ctrl on Windows and Linux, then select a record bar.
  2. Hold Shift and select another bar. Blue selects the range between the anchored bar and that bar.
  3. Drag one selected bar. Blue moves all selected records and preserves the gaps between them.

Use automatic scrolling

Drag a bar near the left or right edge of the visible timeline. Blue scrolls in that direction so you can reach a date outside the current view.

Group records into lanes

Select Group by to divide the timeline into horizontal lanes. Each record appears in the lane that matches its field value.

Each lane shows:

  • Its group name and record count in the left panel
  • A collapse or expand control to hide or show the lane’s bars

You can group by list, status, assignee, tag, or a select or date custom field. These are the same grouping options available in other views.

Display dependencies

When you configure record dependencies, the Timeline view draws arrows between dependent records.

Use the dependency control in the toolbar to select a display mode:

  • Always: Show all visible dependency arrows.
  • On hover: Show arrows connected to the record under the pointer.
  • Hidden: Do not show dependency arrows.

Blue stores this setting for the workspace and applies it when you return.

Move dependent records with Cascade

Enable Cascade with the chain icon. When you move a record, Blue moves all downstream dependent records by the same amount.

For example, Record A blocks Record B, and Record B blocks Record C. Moving Record A two weeks later also moves Records B and C two weeks later.

Cascade retains the gaps and order in the schedule. It applies only when you drag a bar’s body, not when you resize a bar.

Show the critical path

Enable Critical Path with the lightning bolt icon. Blue highlights visible records whose downstream dependency chain reaches the latest due date.

Blue calculates the highlighted records as follows:

  1. Blue creates a dependency graph from visible records.
  2. Blue finds the latest due date reachable through each record’s downstream dependency chain.
  3. Blue identifies the latest reachable due date across the graph.
  4. Blue highlights each record whose dependency chain reaches that date.

Filter the timeline

Select Filter to limit records by list, assignee, tag, status, custom fields, date ranges, or other supported criteria.

Filters remain active when you switch views.

Save timeline settings

A saved view stores the timeline’s zoom, date configuration, grouping, dependency display, cascade state, and critical path state.

Workspace members who open that saved view receive the same timeline configuration.